Gordon Moyer
DERIVING THE ROTATIONAL TRANSFORMATION EQUATIONS FOR SPHERICAL POLAR COORDINATES FROM A MENELAUS FIGURE

__
I hope to write a book detailing the history of a single problem in mathematics, the two thousand years in which mathematicians developed increasingly sophisticated ways of changing the coordinates of a point in one reference system into the coordinates of another. The title of my book might be From Ptolemy to Tensors: The History of Celestial Coordinate Transformations.
Considering that coordinate conversions are usually not taught until the second half of a course in trigonometry, it comes as a surprise to many students that the ancient Greek astronomer Ptolemy showed how one could solve any kind of coordinate transformation in his Mathematical Syntaxis, commonly known as the Almagest, written around 150 A.D. How did Ptolemy do it? He used state-of-the-art mathematics for the First Century, a theorem discovered just a generation earlier by one of the most brilliant minds of the ancient world, Menelaus of Alexandria.
Because of its usefulness in defining the directions of stars and planets in the sky, trigonometry first developed as a branch of astronomy; foremost among the astronomer-trigonometricians was Menelaus. His theorem revealed an intriguing relationship between parts of a four-sided configuration made up of two intersecting triangles inscribed on a sphere. During the Middle Ages, this figure came to be called the figura sectoris or figura cata, the Sector- or Transversal-Figure. It dominated positional astronomy in Medieval Europe; it would not be overstating things to say that for a thousand years this science, at least in the Latin West, was all about applying Menelaus' figure. From Ptolemy onwards—well into the 1600s—mathematical astronomers used the Figure to change the coordinates of celestial objects expressed in one system, say that based on the horizon, into a completely different system, one based on the celestial equator, for example.
Today, the Sector-Figure is remembered only by a few historians of astronomy. Resurrection of Menelaus' figure may be at hand, however! Although it was often time-consuming to use, and finally abandoned in favor of more elegant and streamlined methods of converting coordinates, I have found that the Menelaus Figure proves useful in drawing correct transformation diagrams, both for two and three dimensional cases.
If a student has trouble remembering the equations for converting coordinates, he or she can get them back again by sketching a Cartesian frame and rotating it about its origin to a new position. Still, figuring out where you must draw the line-segments on the coordinate axes so as to derive the correct sets of equations can be tricky. The ancient Menelaus Figure, though, can be dusted off and used to quickly ascertain what segments of the axes lead to the proper transformation formulae.
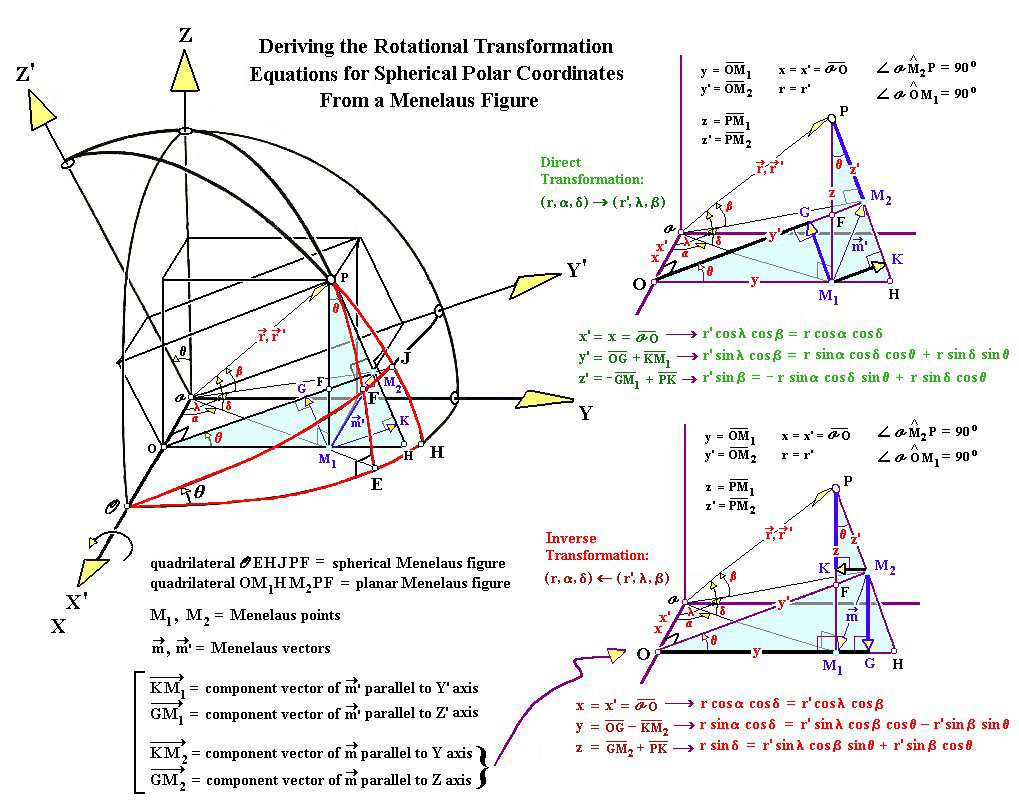
I have discovered that a certain vector set up on a Menelaus Figure easily locates all the required line-segments for deriving the modern sets of transformation equations. I call this the Menelaus vector. What an anachronism, combining vector analysis with a figure so medieval! This vector, which I have labeled m' in my diagram, and its opposite, labeled m, extend between the only two principal points forming the Menelaus Figure that do not lie on any of the quadrilateral's corners. These are the Menelaus points.
As I have shown, by resolving the Menelaus vector into its components (following the usual rules of vector resolution), one can easily locate all the line-segments needed to derive the formulae of transformation. One merely draws the Menelaus Figure so that its four sides lie on both pairs of coordinate axes, the rotated as well as the unrotated pair.
My diagram connects the ancient with the modern, demonstrating geometrically how the standard transformation equations we use today are related to a theorem and figure developed in late antiquity. In fact, the diagram reveals how the two transformation approaches, so far removed in time, are mathematically linked: the modern rotational method involves a mapping of one Menelaus point into the other.
![[ToC]](46_toc_t_off.gif)